A LiDAR can count and track people without capturing faces or images, by day and by night, with position errors of a few centimetres. The best published results exceed 90 % tracking accuracy, but in very dense crowds, at long range or with dark clothing, performance drops. This article sums up what it measures, how the data is processed, what studies with real data show and where its limits are.
What a LiDAR is
A LiDAR (Light Detection and Ranging) emits pulses of laser light and measures how long they take to come back after bouncing off a surface. Since light travels at a known speed, the round-trip time gives the distance:
d = (c × t) / 2
where c is the speed of light and t the measured time; it is divided by two because the pulse travels out and back. By repeating the measurement hundreds of thousands of times per second in different directions, the sensor builds a point cloud: a set of (x, y, z) coordinates that draws its surroundings in 3D (NOAA). Each point also carries its intensity, how much light came back, which depends on the material and colour.
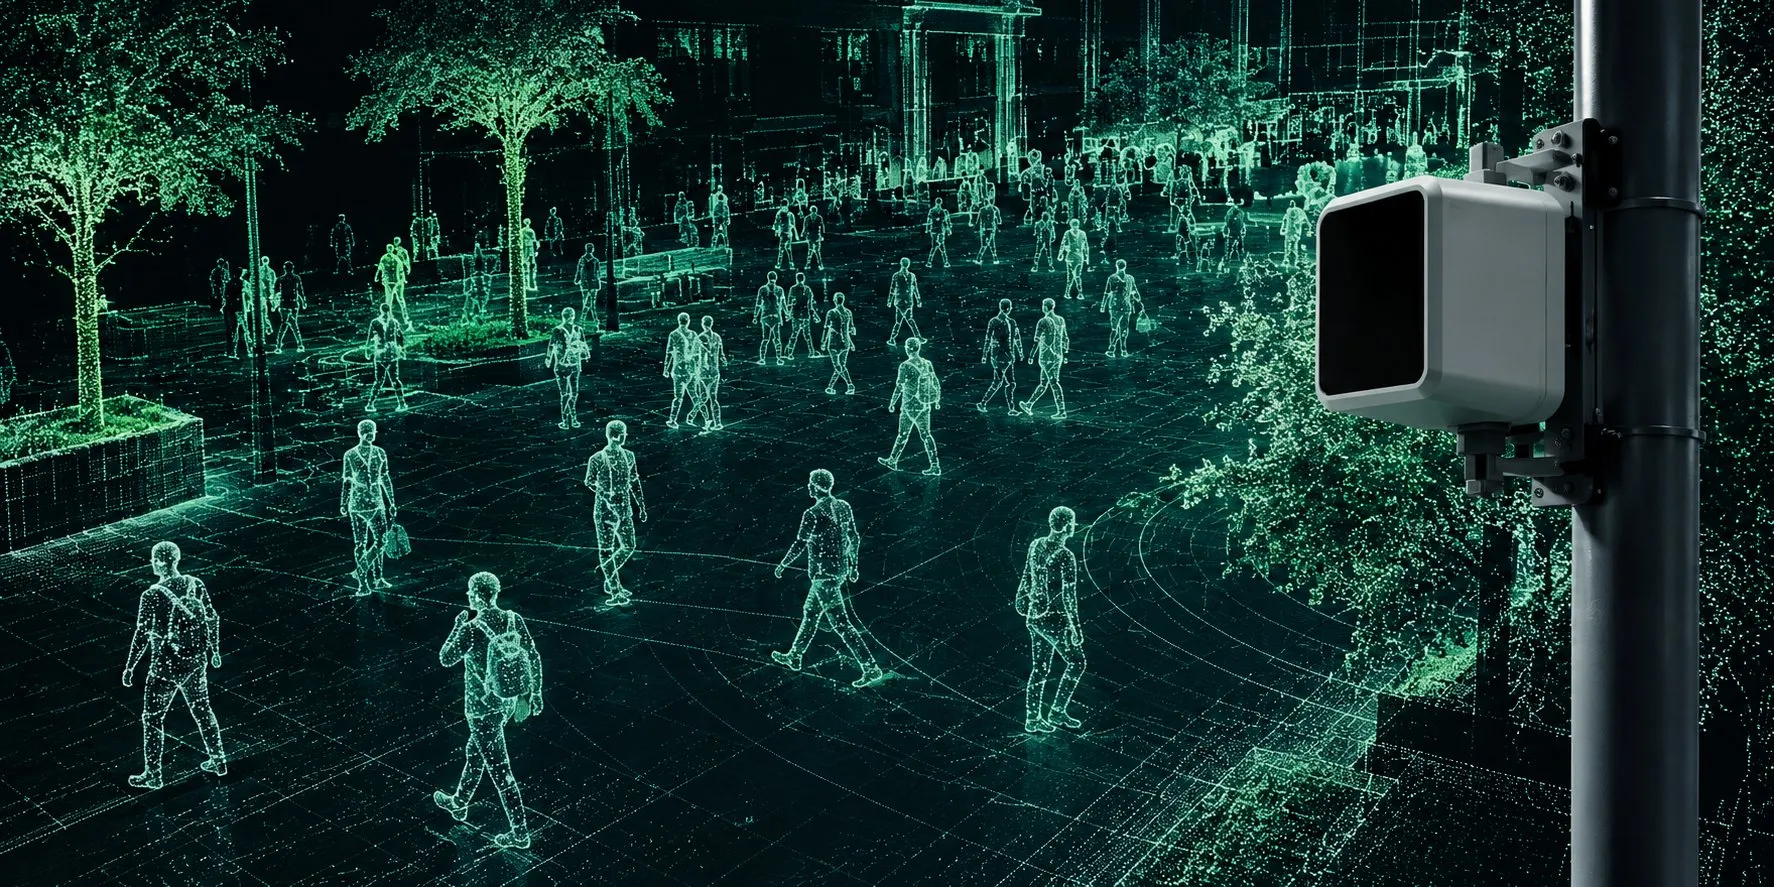
Illustration: how a LiDAR “sees” a square. Each person is a set of 3D points, with no face or colour.
The technology was not born for crowds. The first systems were used in meteorology and mapping; in 1971 the Apollo 15 mission mapped the Moon with a laser altimeter (Wikipedia). It then became a key sensor for autonomous vehicles, and in recent years it has been tested to measure flows of people in stations, airports and public spaces (Khanfor et al., 2026).
There are sensors with rotating mirrors that sweep 360°, solid-state sensors with a narrower field of view, and sensors with non-repetitive scan patterns that fill in the scene over time. To monitor people they are usually mounted in a fixed position, up high: on a street light, a ceiling or a mast.
What can be measured
The review by Khanfor and colleagues, published in IEEE Internet of Things Magazine in 2026, organises crowd monitoring with LiDAR into four tasks (Khanfor et al., 2026).
| Task | What you get | What it is for |
|---|---|---|
| Detection | Presence and 3D position of each person | Knowing which areas are occupied |
| Counting | Number of people, total or per zone; density in people per m² | Occupancy, density maps, entries and exits across a line |
| Tracking | Trajectory, direction and speed of each person between frames | Flows, queues, dwell times, bottlenecks |
| Behaviour | Normal patterns and deviations: stalled flow, counterflow, sudden dispersal | Detecting situations that depart from the usual |
Several kinds of features are extracted from the point cloud: geometric (height of 1.5 to 2 m, proportions), spatial distribution (distance between people, groupings), temporal (speed and direction between frames) and reflectivity, which help separate people from their surroundings (Khanfor et al., 2026).
Tracking is what sets LiDAR apart from a door counter. Measuring speeds makes it possible to compute indicators that density alone does not give, such as the “crowd pressure” proposed by Helbing and colleagues: density multiplied by the variance of speed, which in the Jamarat Bridge disaster (Mecca, 2006) signalled turbulence before the disaster (Helbing et al., 2007).
How a person is counted and tracked
A point cloud comes without labels: it is an unordered set of coordinates, without the grid of an image, so it needs its own algorithms (Khanfor et al., 2026). The usual process with a fixed sensor has five steps:
- Filter and remove the background. Noise, the ground and everything that does not move (façades, street lights, furniture) are removed. With a fixed sensor, the background is learned once and subtracted from every frame.
- Cluster. The remaining points are grouped by proximity (clustering); each group is a candidate object.
- Classify. The system decides which groups are people, by their shape and size or with a neural network trained for point clouds (PointPillars, CenterPoint, PointNet++ and similar).
- Track. Each detected person is matched with the one in the previous frame to form a trajectory, usually with a Kalman filter that predicts where they will be.
- Aggregate. Trajectories become metrics per zone: count, density, entries and exits, speed, dwell time.
All of this can run on a small computer next to the sensor. Published systems count on a Jetson Nano in 17.4 ms per sample (Chen et al., ASU), and a network of 20 sensors in a station was processed with a Jetson Orin NX (Hishida et al., 2026). Processing on site has an added advantage: the point cloud can be discarded right there and only the metrics sent on.
Many of the building blocks exist as open-source software with licences that allow commercial use: the Livox SDK (MIT), Autoware with modules for ground segmentation, clustering, detection and multi-object tracking (Apache-2.0), OpenPCDet for training 3D detectors (Apache-2.0), and the PCL (BSD) and Open3D (MIT) libraries.
How far away it sees people
The range on a data sheet is not the range for counting people. Manufacturers give it for a specific reflectivity, and clothing usually reflects much less than a calibration panel.
An example with a common compact sensor, the Livox Mid-360S:
| Surface | Reflectivity (905–910 nm) | Range |
|---|---|---|
| White calibration panel | 80 % | Up to 70 m (data sheet) |
| Manufacturer’s reference | 10 % | 40 m (data sheet) |
| Commercial black polyester | Under 3 % (patent US11656388) | Below 40 m |
| Light clothing, skin, hair | Intermediate, depending on colour | No published figure |
| Reflective vests | High | The exception |
Accuracy also changes with distance. A study that measured 35 units of the Mid-360 found that all of them met the specification, with a jump in vertical error around 10–12 m (Mitka and Klapa, 2025).
Placement matters as much as the sensor. Many compact LiDARs are designed for robots and look mostly upwards: the Mid-360 sees from −7° to 52° vertically (Livox). Mounted a few metres up in the normal position, it barely sees nearby heads; mounted upside down, looking at the ground, it covers the nearby area better. Height and tilt must go into any coverage calculation, and it is worth simulating them before installing.
As an order of magnitude, these are the people who fit in the circle a sensor watches, depending on its useful radius and the density:
| Useful radius | Area | At 2 people/m² | At 4 people/m² |
|---|---|---|---|
| 10 m | 314 m² | about 630 | about 1,260 |
| 20 m | 1,257 m² | about 2,500 | about 5,000 |
| 40 m | 5,027 m² | about 10,000 | about 20,000 |
Area = π × radius². In practice, several sensors with overlapping zones work better than a single one trying to cover a lot, especially when people block each other.
What the evidence says
Studies with real sensors give good results at low and medium densities, and drop clearly when people are packed together. The usual metrics are MOTA and HOTA for tracking (from 0 to 1, or in %, higher is better), mAP and F1 for detection, and the mean error in number of people for counting.
| Study | Setup | Result |
|---|---|---|
| Hishida et al., Nagoya Univ. and JR Central, 2026 | 20 LiDARs at 10 Hz in the concourse of Nagoya station, processed with Jetson Orin NX | HOTA above 90 % over about 900 m² |
| Osaka Univ., tracking with occlusions | One wall-mounted sensor, entrance of a shopping centre | MOTA 0.914 with heavy occlusions |
| Ohno et al., Osaka Univ. | 70 LiDARs in a building | Recognises the same person when moving from one sensor to another without using images |
| Chen et al., Arizona State Univ. | LiDAR on a campus street light | Mean counting error of 0.38 people; 17.4 ms per sample on Jetson Nano (later version) |
| Jayawickrama et al., Aalto, 2026 | LiDAR looking down from 2.94 m | MOTA 0.83, IDF1 0.93; about 35 ms per frame |
| Belbachir et al., NORCE, 2025 | 128-beam LiDAR at a conference | A Random Forest reaches F1 of 0.93 in 12 ms, as good as PointNet and 2.5 times faster |
| Romero Blanch, Escalera et al., UB and CVC, 2024 | LiDAR for video surveillance | Pedestrian mAP of 0.876 between 0 and 20 m |
| Lorente, Casas, Royo and Caminal, UPC, 2021 | Pedestrians in point clouds with PointNet++ | 99.1 % precision and 98.6 % recall on their own data |
| Li et al., 2025 | LiDAR and cameras with tightly packed pedestrians | MOTA of only 0.17 to 0.35 |
Two takeaways. First: a huge model is not needed; at the edge, simple methods perform almost as well and much faster. Second: the figure that matters depends on the scenario. A 90 % in a station concourse does not carry over to a packed crowd in the street, where the best systems still struggle.
There are also deployments outside the lab. Ferrocarrils de la Generalitat Valenciana tested a LiDAR system at Luceros station in Alicante (Outsight); Network Rail bought a LiDAR crowd monitoring system for Waterloo station after several trials (GOV.UK); and on Germany’s North Sea coast almost 60 sensors tell tourists how busy the beaches are (Blickfeld). These cases are published by the vendors and include no accuracy figures.
Limitations
- Occlusion and density. People block each other. In very packed crowds tracking degrades, and at long range resolution drops (Khanfor et al., 2026). This is the most important limit for measuring crowds.
- Real range. It depends on clothing and on the sensor’s height and tilt; the data sheet value is a maximum under favourable conditions.
- Cost and computing. High-resolution sensors are expensive and processing point clouds in real time requires dedicated hardware; the same review cites this as a main barrier, together with storage (Khanfor et al., 2026).
- Weather. It works at night and copes with light rain or fog, but performance drops in heavy rain or dense fog.
- Calibration between sensors. Several LiDARs must know their relative position and synchronise their clocks. Recent methods achieve errors of 5 cm and 1° in difficult cases, but they are designed for sensors mounted on the same vehicle (Duan et al., 2024).
- Little open data. Almost all LiDAR crowd datasets come from vehicles or robots and have non-commercial licences, such as STCrowd (219,000 pedestrians, CC BY-NC-SA). With a fixed sensor and an open licence, PointCloudPeople (CC BY 4.0) stands out, as does CrowdBot v2 (CC BY 4.0), recorded from a robot in Lausanne markets. Every new installation needs its own validation data.
- Privacy is not automatic. A point cloud has no faces, but it has been shown that a person can be recognised by their gait with LiDAR: LidarGait identifies 1,050 people and does better outdoors than with a camera (Shen et al., CVPR 2023). If trajectories or raw clouds are stored, the data may still be personal; the prudent approach is to process on the sensor itself, keep only aggregated metrics and treat temporary identifiers as pseudonymised data (AEPD, in Spanish).
LiDAR, cameras and other options
No sensor wins at everything. Cameras are still the main source in the people-counting market (DHS/NUSTL, 2024): they are cheaper, more mature, and many cities already have them installed. LiDAR brings something else: geometry in metres, independence from lighting and no images.
| 3D LiDAR | Camera with computer vision | Wi-Fi or Bluetooth | |
|---|---|---|---|
| What it measures | Position and shape in 3D | Colour image | Devices that emit a signal |
| Counts | People | People | Phones, not people |
| At night | Yes, it emits its own light | Depends on lighting | Yes |
| Images of people | No | Yes, unless anonymised during processing | No |
| Speed and trajectory | Direct, in metres | Estimated from the image | Very approximate |
| Cost | High | Low or medium; can reuse existing cameras | Low |
| Weak point | Occlusion, real range, cost | Occlusion in dense crowds, lighting, privacy | Misses anyone without a phone or with it switched off |
The table summarises the comparison by Khanfor et al., 2026 and the review of methods by Hussein et al., 2024, which notes that video fails in dense crowds because people hide one another.
In practice, the most complete systems combine sources. At the Manchester Airports Group airports, LiDAR, 3D stereo cameras and the airport Wi-Fi network are used together (Airports International). LiDAR fits best where precise measurement is needed in specific zones, at night or without capturing images.
Sources
- Khanfor, Zaghouani, Ghazzai, Alsharoa and Setti (2026). LiDAR for Crowd Management: Applications, Benefits, and Future Directions. IEEE Internet of Things Magazine.
- NOAA. What is LIDAR?
- Lidar, Wikipedia.
- Helbing, Johansson and Al-Abideen (2007). Dynamics of crowd disasters: An empirical study. Physical Review E 75, 046109.
- Hishida et al. (2026). LiDAR people tracking at Nagoya station.
- Ohno et al. Privacy-preserving Pedestrian Tracking using Distributed 3D LiDARs.
- Osaka University. Tracking with point clouds and occlusions.
- Chen et al., Arizona State University. LiDAR counting on street lights and HAWC-CC.
- Jayawickrama et al. (2026). Overhead LiDAR for people detection and tracking.
- Belbachir et al. (2025). People detection with LiDAR at a conference.
- Romero Blanch, Escalera et al. (2024). LiDAR-Assisted 3D Human Detection for Video Surveillance. WACV Workshops.
- Lorente, Casas, Royo and Caminal (2021). Pedestrian detection in point clouds with PointNet++.
- Li et al. (2025). Tightly packed pedestrians with LiDAR and cameras.
- Mitka and Klapa (2025). Accuracy of the Livox Mid-360. ISPRS Archives.
- Duan et al. (2024). Rotation Initialization and Stepwise Refinement for Universal LiDAR Calibration.
- Shen et al. (2023). LidarGait. CVPR.
- AEPD. Anonymisation and pseudonymisation (in Spanish).
- DHS/NUSTL (2024). Crowd counting market survey.
- Hussein et al. (2024). Review of crowd anomaly detection. Franklin Open 8.
- Data sheets and cases: Livox Mid-360S, Mid-360 specifications, patent US11656388, FGV and Luceros, Network Rail, North Sea, Manchester Airports.
- Data and software: STCrowd, PointCloudPeople, CrowdBot v2, Livox-SDK2, Autoware, OpenPCDet, PCL, Open3D.